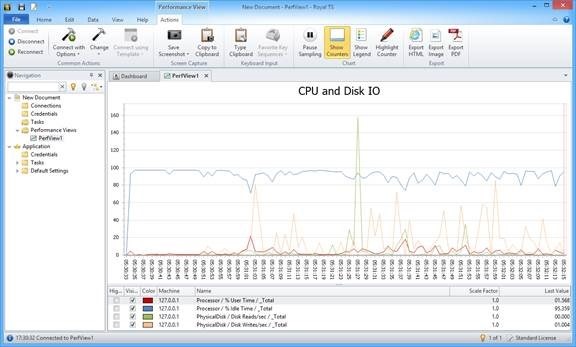
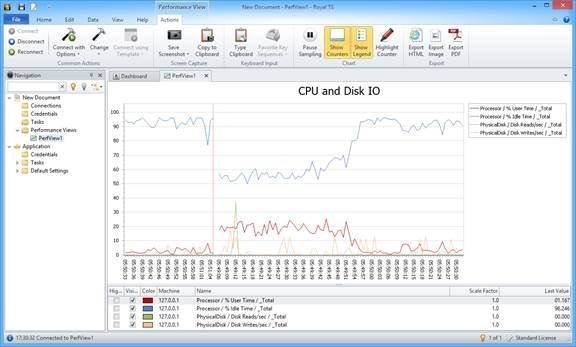
With Royal TS 2.2 we are proud to introduce the new “Performance View”. This type of connection enables you to have a real-time view on your servers using Windows performance counters. This way you can leverage your already configured servers and immediately see how they are performing.
Background: Windows Performance Counters provide detailed information on how an operating system, a service or an application is performing. You can use this data to monitor the system, identify bottlenecks and problems. All current Microsoft operating systems provide this feature.
For more information please visit Performance Counters (Windows) on MSDN.
Creating a “Performance View”
Since we are going to integrate more and more new Connection Types in Royal TS using our plugin architecture we also want to make sure that usability isn’t suffering from this. To ensure that, an updated UI for adding new objects was created in Royal TS 2.2:
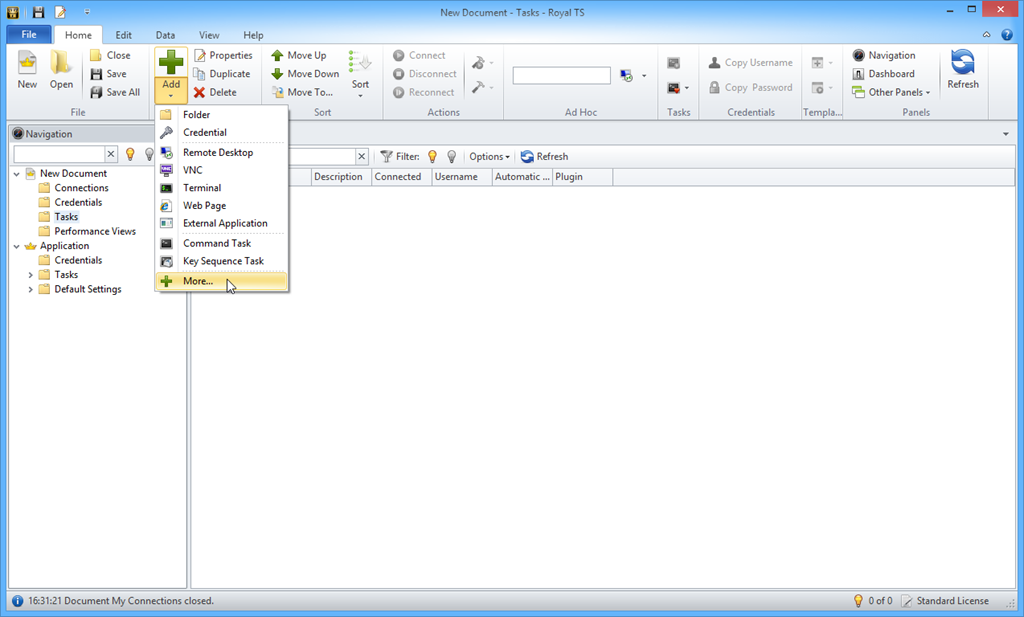
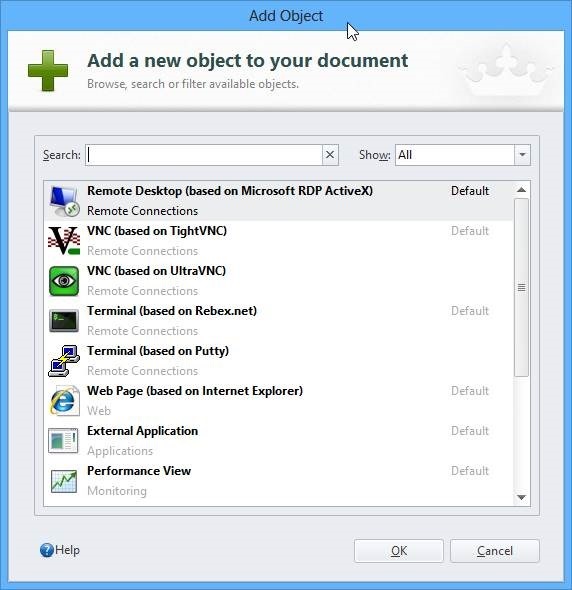
The green “+” icon in the Home ribbon will lead you to a new “Add Object” dialog which lets you decide what kind of object you want to add to your document. Below you have a dropdown arrow that lets you select the most common object types (no changes here).
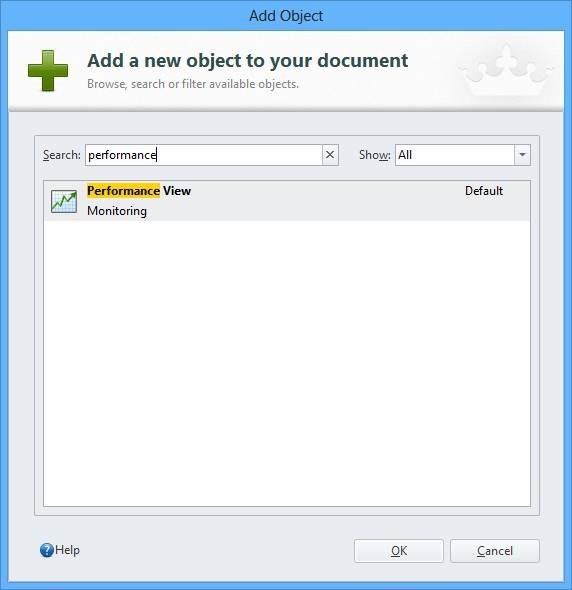
You can filter this list to show only connections, tasks, credentials or templates. And most importantly you can just type the name of your favorite connection type and press ENTER to select the first in the on-the-fly filtered list:
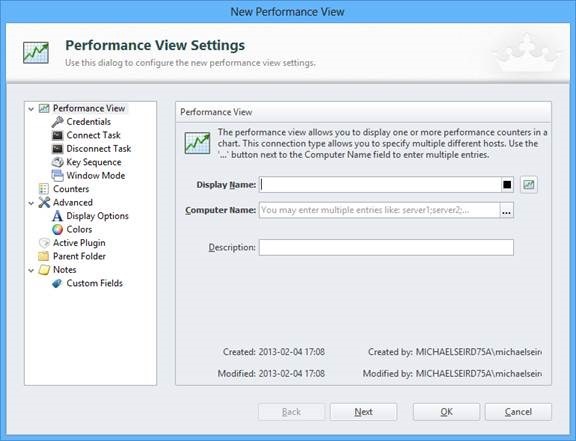
The performance connection has the standard properties that are well known already:
But there is one difference to the other connections Royal TS has implemented so far: All existing connections work with a single Computer name/URI as their primary target. Introducing the Performance View we decided to enhance the flexibility to be able to specify multiple Computer Names/URIs for one performance view.
Why?
Just imagine the following scenario: As an administrator you want to see for all 5 webservers of your web-farm how the CPU is doing. Since you can specify “server1;server2;server3;…” this is easy. You may also click on the “…” button next to the Computer Name to enter multiple machines (IPs) in a list. In case you are creating a new performance view, you can also control whether Royal TS should create a single connection containing all machines or create an individual performance view for each specified machine (bulk-add).
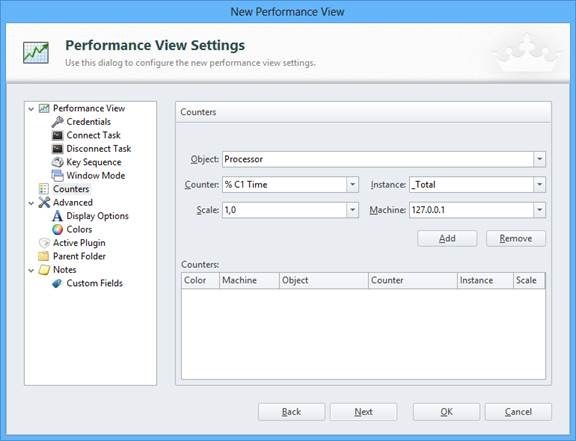
The “Counters” page allows you to specify the performance counters you want to see in your performance view as you probably know it from the Windows Performance Monitor:
- Object: this is like the category of a performance counter
- Counter: this is the performance counter
- Instance: some counters can be further drilled down into instances
- Scale: since all counters are shown in the same graph it makes sense sometimes to scale a counter so all can be shown at the same time
- Machine: if you have specified a single host in the “Computer Name” field you find it here, if you specified more, you can select from which host you want to have the counter or if you want to see them all
After adding a counter you can also specify its Color in the graph.
Tip: Please be aware that Royal TS is reading the performance counter probably from a remote host that requires authorization. So configure your security as you used to do with Royal TS to enable this.
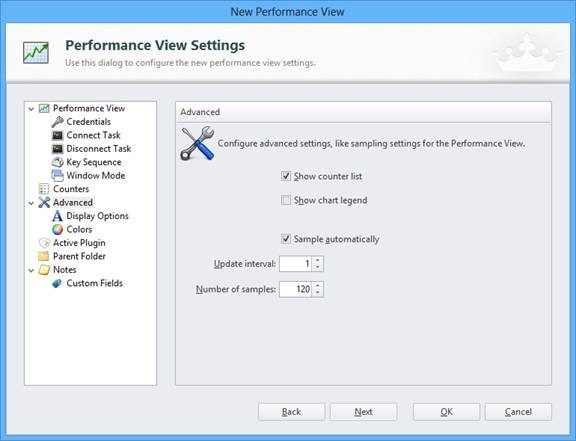
In the “Advanced” page, amongst other configurations, you can define how often data is shown and for how long in the past.
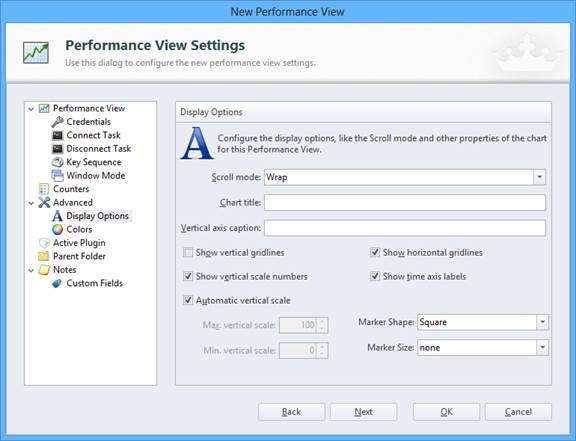
In “Display Options” you can fine-tune the performance chart – and most importantly the “Scroll mode“:
- “Warp” works like the Performance Monitor of Windows – if the right side of the chart is reached it restarts at the left (loops back to start)
- “Scroll” works like the Windows Task Manager: it “scrolls” the data and always shows you the most current x measure points
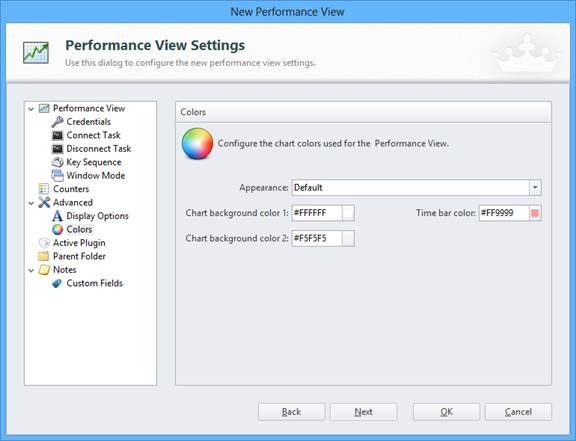
In the “Colors” page you fine-tune some colors of the chart and can also set a general Theme for the chart.
Working with a connected “Performance View”
In the ribbon you can further work with the Performance View:
- Pause the sampling for some time
- Show/Hide the counter list at the bottom and the Legend
- Highlight some of the counters (which makes the corresponding graph a bit thicker)
- Export possibilities (HTML, Image in different formats, PDF)
Hint: If you happen to see <no data> in the Counter List (at the bottom of the graph) this could have two reasons:
- The network latency was too big and the read-attempt was canceled because a timeout happened
- Royal TS has issues reading the Performance Counter because of a wrong computer configuration, wrong performance counters or security.
In both cases Royal TS is not retrying to read this Performance Counter for the next minute . Please see more information in the Log Panel of Royal TS.
In another blog post we will dig deeper into some advanced tips and tricks using performance view templates.
cheers, Michael
